How big is my household carbon footprint?
How much carbon dioxide does our household release? Where do these emissions come from? How is it changing over time? These are the critical questions that need accurate data so that I can begin to plot a sensible route to get to net zero. Here I work out and plot our household carbon dioxide emissions.
What makes up a carbon footprint?
At the broadest level a carbon footprint is simply a measure of how much carbon dioxide is released by a process or activity. You can measure carbon footprints at individual levels, or at household levels, or at larger levels like towns and countries. There's also nuance in measuring these footprints because gases other than carbon dioxide can contribute to global warming. One common example is methane, or natural gas, which is a potent greenhouse gas. We account for these differences by converting all gases into a carbon dioxide equivalent so numbers can be compared1.
I want to understand exactly how big my household carbon footprint is and how it's changing over time. It's critical to have accurate data to support a realistic route to a personal net zero.
There's lots of ways to breakdown a carbon footprint, but for now I'm going to say it's broadly made up of emissions from:
- Household energy, including natural gas and electricity, etc.
- Transportation, including petrol, diesel, air travel, etc.
- Diet, including emissions from food eaten both in and out of the home
- Goods and services, including all emissions from durable goods manufacture and other services
Household energy and transportation are the easiest to begin with as the data are more readily accessible. I'm going to focus on these two for this article. Diet and goods and services are also very important but are much harder to get good data on at a personal level, so I will focus on these in a later article.
Household energy and transport carbon emissions
I can summarise my household energy and transport carbon footprint in a single figure:
The average value is 7,300 ± 3,000 kg, or 7.3 tonnes of carbon dioxide per year. There are two adults in our household so that's 3.65 tonnes each.
It's pretty clear from this that one of the biggest variable factors is emissions from flights. Some years we flew more than others and that really stands out in the green bars.
Beyond flights, it's also clear that petrol is a significant contributor to emissions. I used to drive a long distance to work in 2005 to 2007, but then stopped as I got a job closer to home. In recent years I've been driving a relatively small amount (just a few thousand miles a year) and this is quite clear in the petrol emissions.
I was also a little surprised by how large and consistent my natural gas emissions are. The fact that these aren't really dropping over time means they will need considerable effort to reduce.
Rather discouragingly, the overall trend is not for a continuing decrease over time. If you exclude the flight emissions, there's a clear drop at the start, but emissions have been plateauing recently:
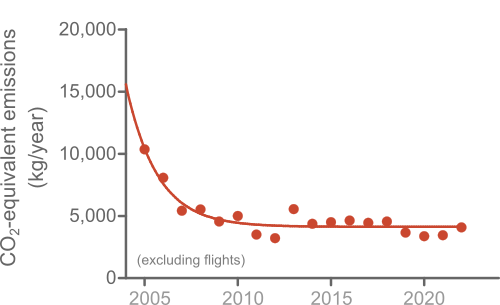
These data follow an exponential one-phase decay pattern, with a plateau at 4.1 tonnes/year (±0.3 tonnes/year). They do not follow a linear decrease over time, and this is bad news from a long-term perspective. It means that the reduction I made by reducing my petrol consumption is not continuing as electricity is getting greener.
So now what?
I am a firm believer that we must all play our part in the transition to net zero. This path is one that can only be navigated confidently through the robust use of data.
My analyses so far have spanned home energy use and transportation, but need expanding to include diet, goods, and services. Nevertheless, this historical perspective gives me a sound baseline to begin mapping my personal activities for the future.
-
This concept is called global warming potential (GWP) of gases. By using the GWP you can scale gases to a single, unified measure, equivalent to an amount of carbon dioxide. For example methane warms the earth about 27-30x as much as carbon dioxide over 100 years so is said to have a Global Warming Potential (GWP) of 27-30. This means that one kilogram of methane is equivalent to 27 to 30 kilograms of carbon dioxide. ↩︎
Posts in this Series
- Zero-cost money saving for hot water
- Planes, Trains, and Automobiles
- Breaking down household natural gas use
- Carbon footprint of my household gas and electricity use
- How big is my household carbon footprint?